← Back to Projects
Data ScienceArchived

Health Outcomes Analysis

OIDD capstone: socioeconomic factors and health outcomes, with models I could actually explain.

Course analysis in Python. Clean the data, plot what matters, try interpretable trees, and write the assumptions next to the charts. Observational data does not get to pretend it is causal. The deadline was real, so communication had to travel with the numbers.

Engineering highlights

  • End-to-end cleaning, viz, and interpretable model exploration
  • Assumptions written up with the results, not buried
Date
Course project
Focus
Data
Build stage
Archived
Disciplines
Data Analysis · Statistical Communication
dataanalysiscoursework
Build snapshot
Health Outcomes Analysis media 1
Full write-up below. The hero is the short version. This is the build story: what I designed, what broke, and why I made the calls I did.

Motivation

Why I started this

What pulled me in, and what I wanted to get better at.

Why I built it

OIDD capstone. Messy health and socioeconomic data, and a writeup that had to stay honest.

What interested me

Fitting a tree is easy. Not overclaiming causality from observational data is the actual work.

What I wanted to learn

Clean, plot, model, interpret, and put assumptions next to the results.

System Overview

How the system fits together

Course analysis of socioeconomic factors and health outcomes in Python, with interpretable models and explicit limits.

01

Prep

Cleaning and feature framing.

02

EDA

Seaborn-driven visual analysis.

03

Models

Decision-tree style exploration with interpretation.

Data flow

Dataset → cleaning → EDA → model fit → written interpretation.

Engineering Breakdown

Broken down by discipline

Each block covers the goal, the design, what broke, what changed, and what shipped.

01Analysis Workflow

Analysis Workflow

Goal

Produce interpretable findings under a fixed course schedule.

Design

Pandas cleaning, Seaborn visuals, decision-tree exploration with explicit assumptions.

Challenges

  • Rigor vs deadline.
  • Avoiding overclaiming causal stories from observational data.

Iterations

  • Raw EDA
  • Model exploration
  • Interpretation pass

Final implementation

Archived capstone analysis with documented assumptions.

Analysis snapshot
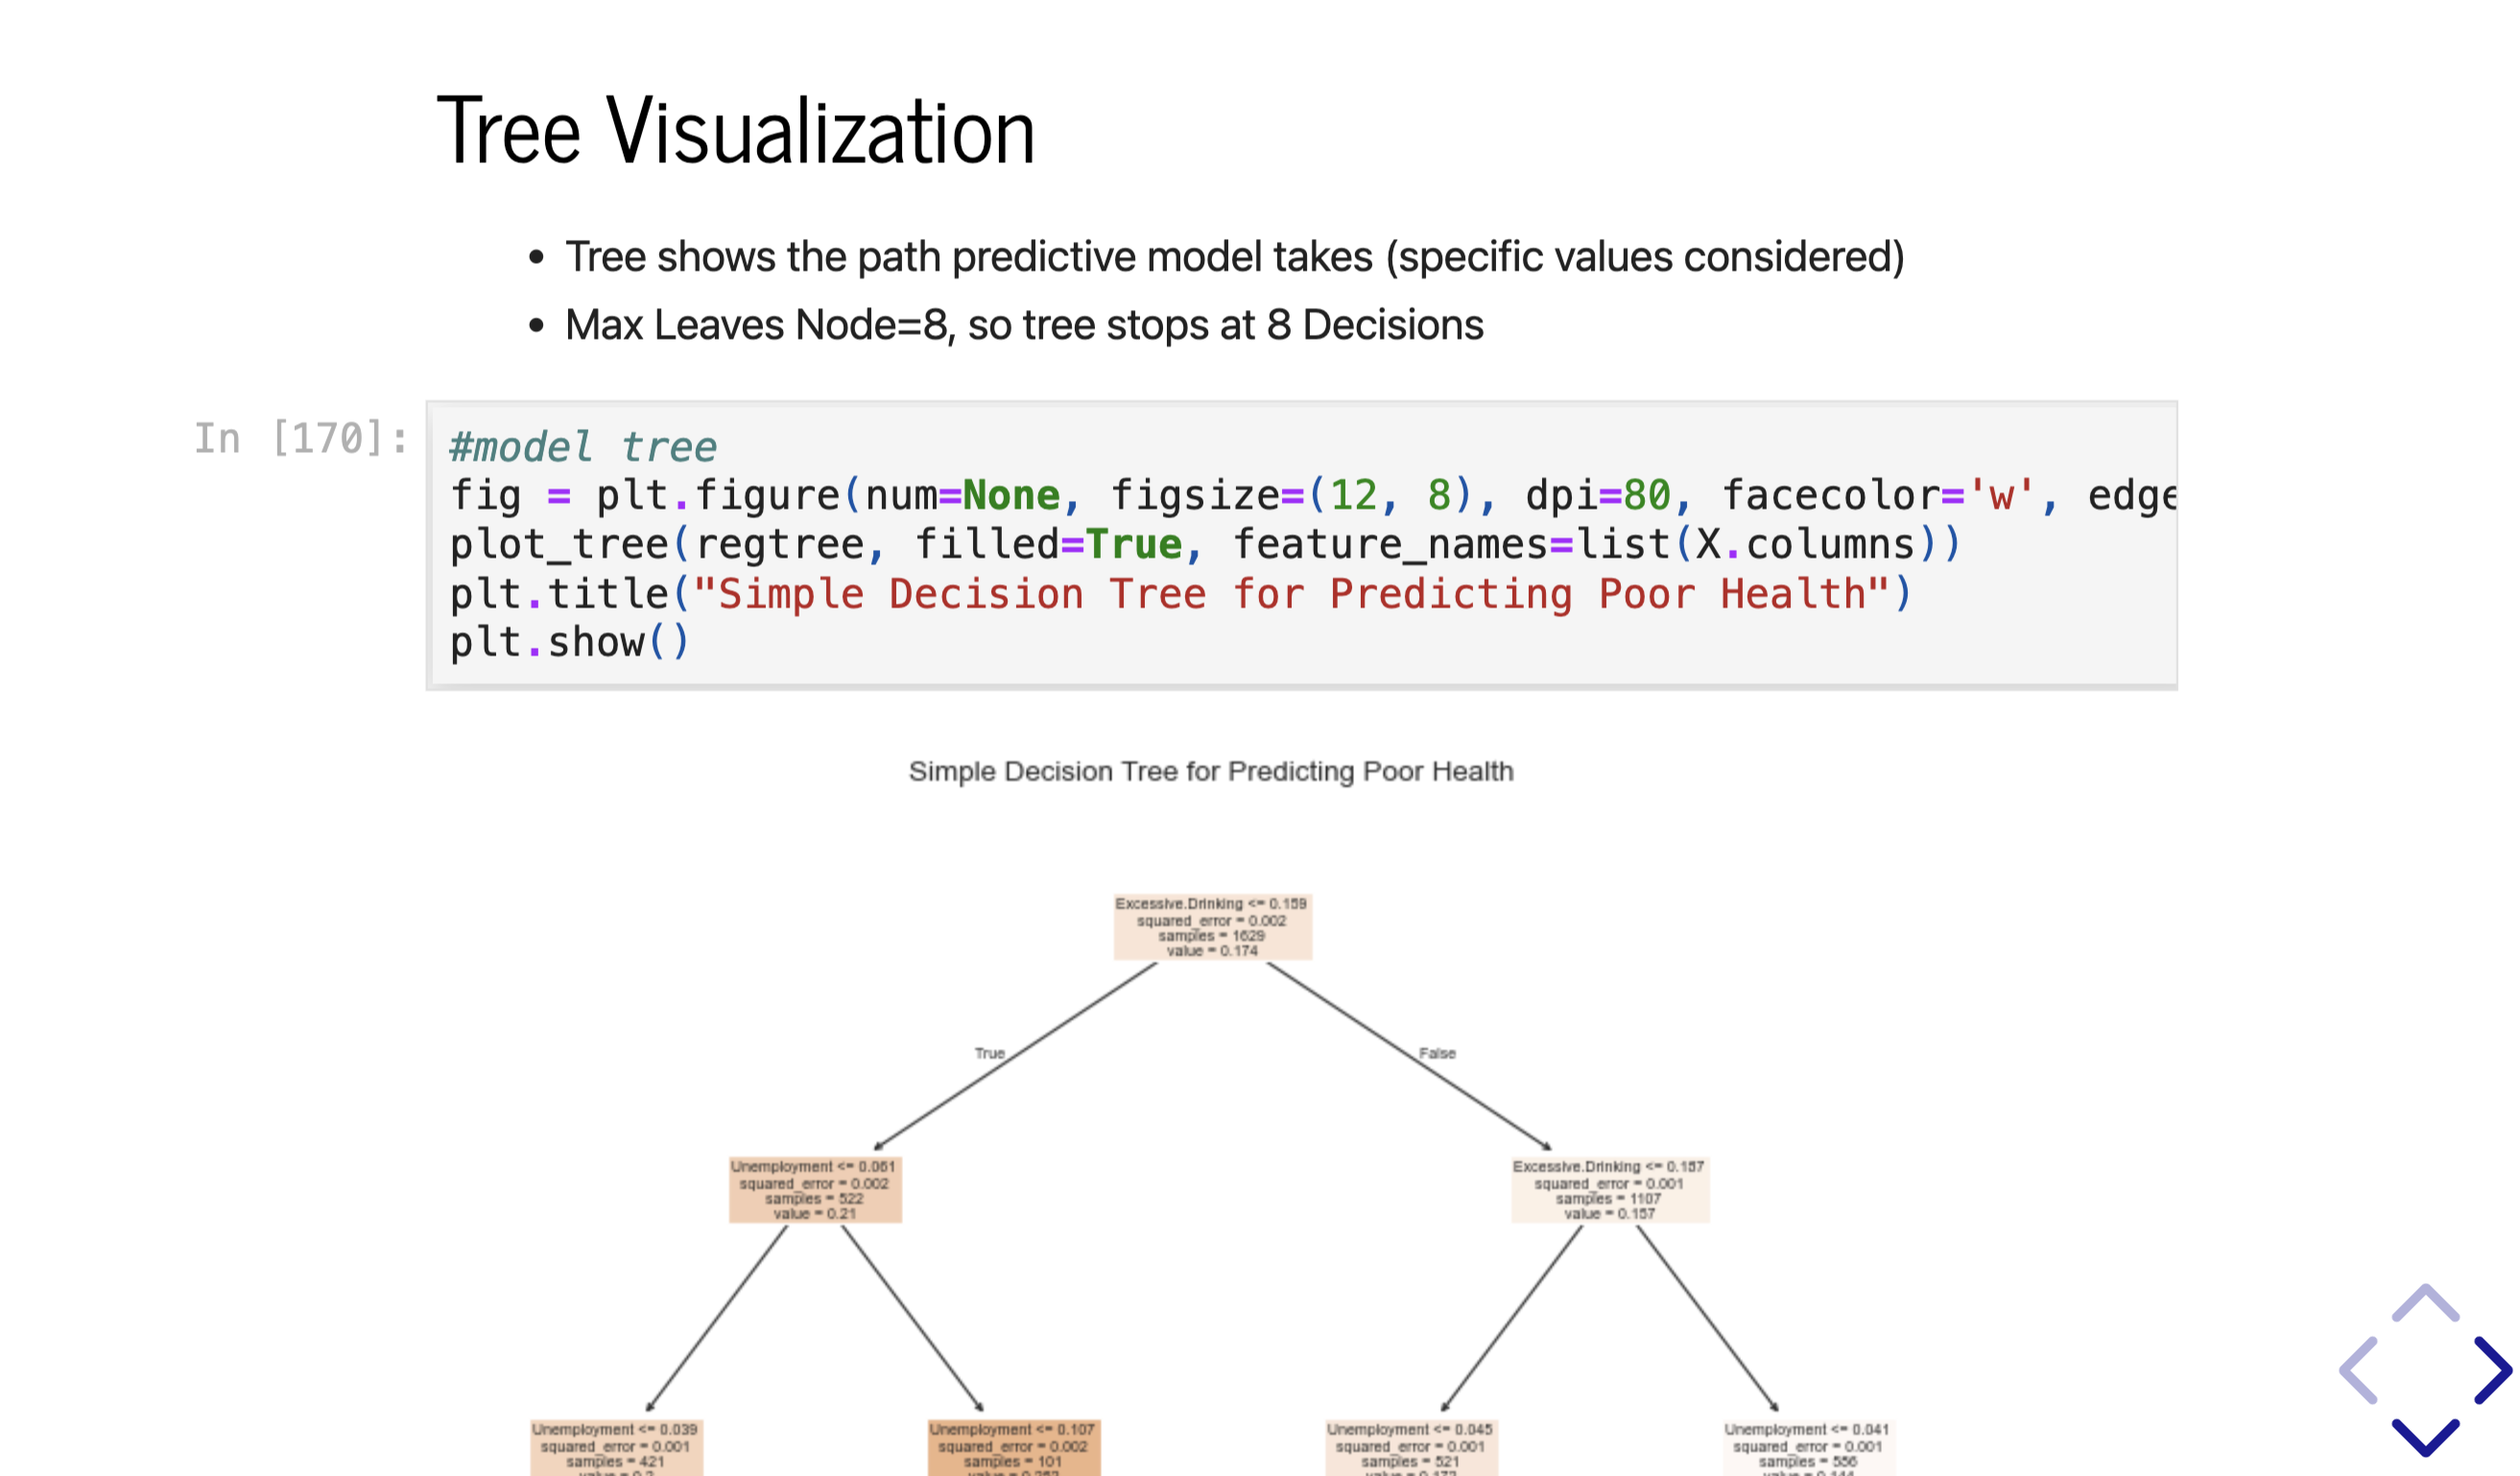
OIDD health outcomes analysis visual

Course capstone analysis artifact.

Key Design Decisions

Calls I actually made

What else was on the table, what I picked, and why it still made sense once the hardware was real.

01

Prefer interpretable models for the writeup

The problem

Maximize AUC or maximize explainability?

Alternatives considered

  • Black-box chase
  • Interpretable trees + clear limits

Tradeoffs

Black boxes impress slides; trees teach stakeholders.

Why I chose this

Interpretable exploration with stated limits.

Evolution

How it got here

Bench bring-up, CAD fits, soldering, and the demos in between. Not just the final photo.

  1. Course

    Capstone arc

    Prep → EDA → model → interpret.

    No media for this milestone yet.

Results & Validation

What held up

What worked in the end, what I can show for it, and where it's still limited.

Completed analysis

Course project artifacts

End-to-end socioeconomic health outcomes workflow delivered for OIDD.

Limitations

  • Archived coursework; not a deployment study.

Reflection

Looking back

What surprised me, what I'd redo, and questions I'm still chewing on.

What surprised me

  • Assumption writeups took as long as fitting.

What I would redesign

  • Earlier data dictionary lock.

Future improvements

  • Stronger causal language discipline if revisited.

Questions that emerged

  • How do you show uncertainty without drowning a non-technical reader?